
Case file 05 · Personal injury firm · Market withheld
Eighteen keywords tracked. Seventeen went up. One went down.
The largest keyword set we have published, in one of the most contested local categories there is, reported in full including the term that lost ground.
0% → 99.4%
Top-three map coverage
Best keyword, 56 days
17 of 18
Keywords improved
One declined, shown below
4
Keywords past 85% coverage
Two of them reached 100%
18
Keywords on one locked grid
Same points, every scan
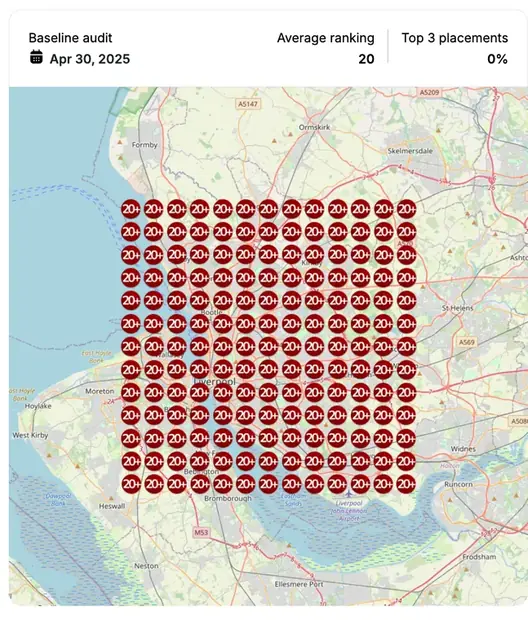
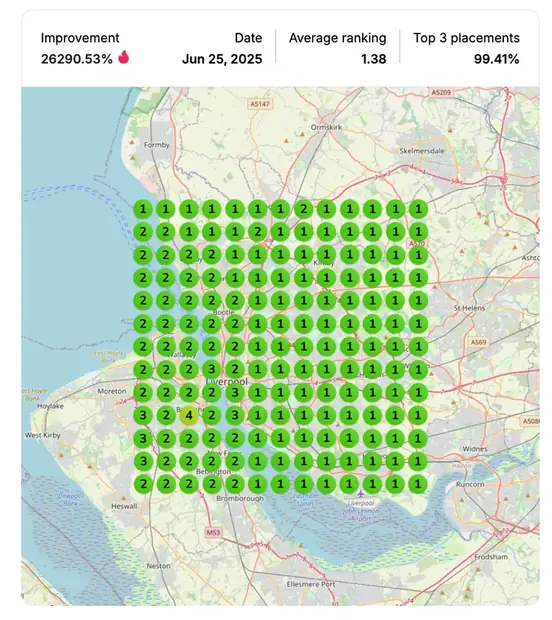
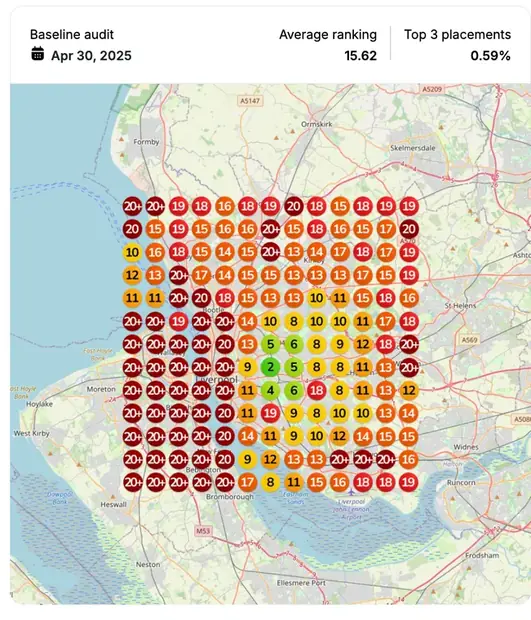
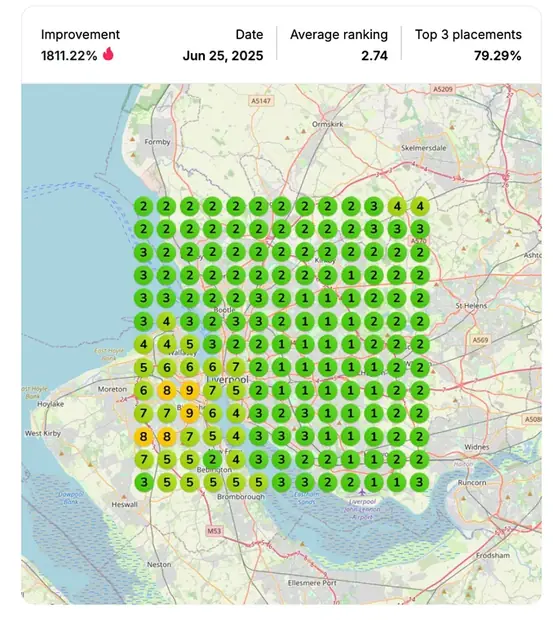
"dog bite lawyer"
Top-three coverage 0% to 99.4%
The situation
What the baseline actually showed.
Personal injury is one of the hardest local categories in existence. The competitors have budgets, the terms carry the highest cost per click in local search, and the pack is defended. It is also the category where a map position is worth the most, because a single matter can be worth more than a year of work in most trades.
The firm came in with a split profile. Some terms had real coverage, like 50.3 percent on one core term and 41.4 percent on another. Others sat at zero. That split is the signature of a profile ranking on brand authority rather than on relevance, which means it wins the searches where somebody already half knows the firm and loses the ones where nobody does.
The zeros are the money. A term at zero is a term where the firm is not in the running for people describing their problem rather than searching for a name.
Goals and measurement window
What we set out to move.
Eighteen terms were tracked across a single locked grid, spanning the core practice terms, the specific injury types and the high-intent near-me searches.
- Move the terms sitting at zero into real coverage, because those are the searches from people who do not know the firm
- Extend the terms already holding position toward full grid coverage
- Keep the set wide rather than reporting on the two or three that move best
- Re-scan across four separate dates so the trend is not a single lucky reading
Measurement window: April to July 2025
What we implemented
The work, in the order it ran.
-
Grid scan and baseline
April 27 and 30, 2025
One grid locked, eighteen keywords baselined against it. The spread of results across those eighteen is what set the priority order for everything after.
-
Competitor teardown
Same week
Pack holders benchmarked on the highest-value terms. In a defended category the teardown matters more, not less, because the gaps are narrower and guessing is expensive.
-
Profile rebuild
Weeks one to four
Categories set against the benchmark. Practice areas listed and described individually rather than collapsed into one line, since a term at zero coverage is usually a term the profile never claimed. Name, address and phone made consistent across citations.
-
Review system
Built in, then ongoing
Review requests built into matter close-out, with prompts that encourage naming the matter type and the area, handled inside the firm’s own compliance rules.
-
Content and proximity
Weeks two to six
Profile and site content aligned to the practice terms so the entity, the services and the searches describe the same firm.
-
Re-scan, report, adjust
June 8 to July 9, 2025
Four re-scan dates against the same locked grid. Seventeen of eighteen terms improved, four passed 85 percent coverage and two reached 100 percent.
This is the same sequence every account runs. See the full process
Before and after
Every keyword we tracked, including the ones that barely moved.
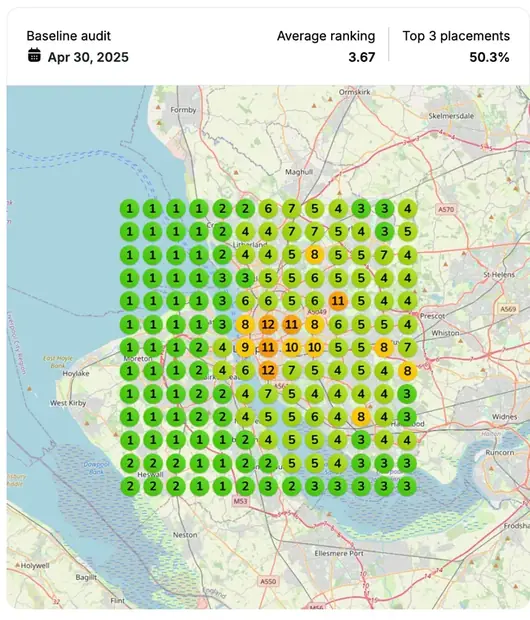
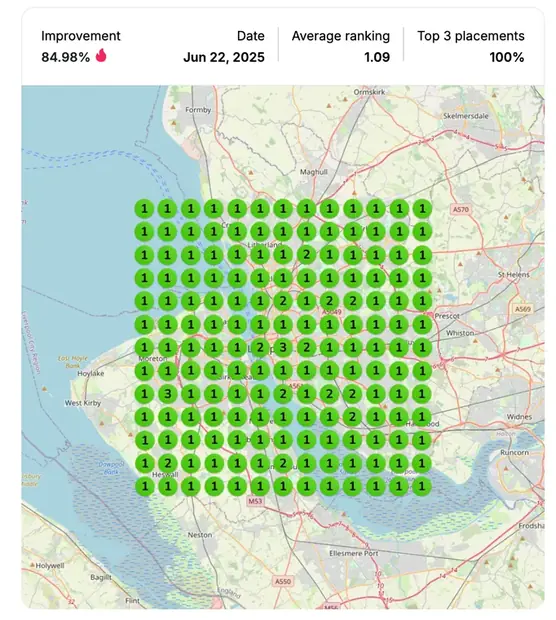
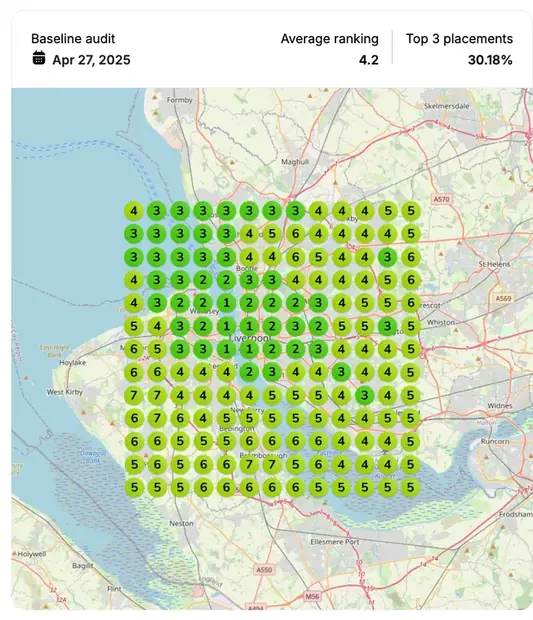
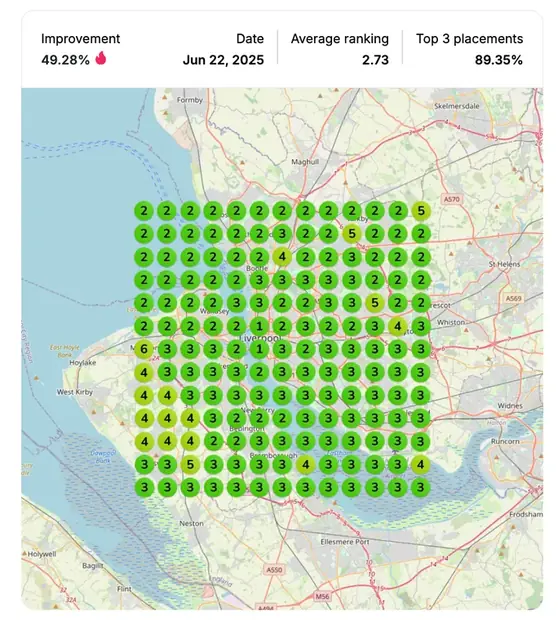
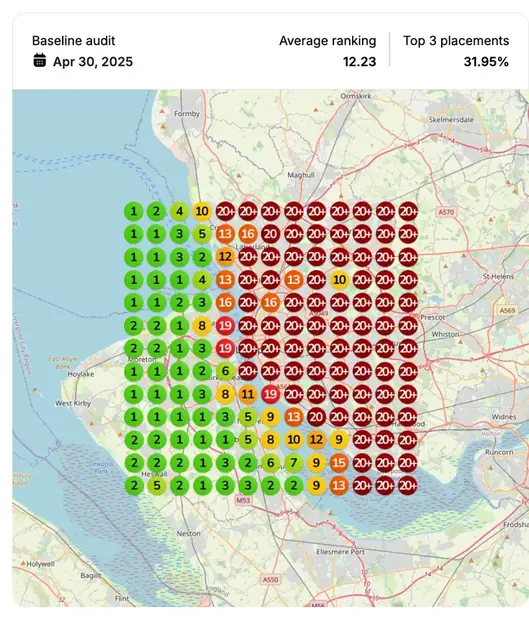
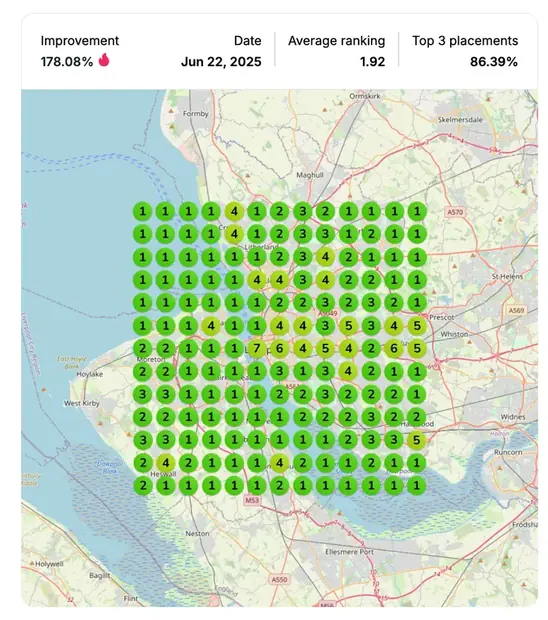
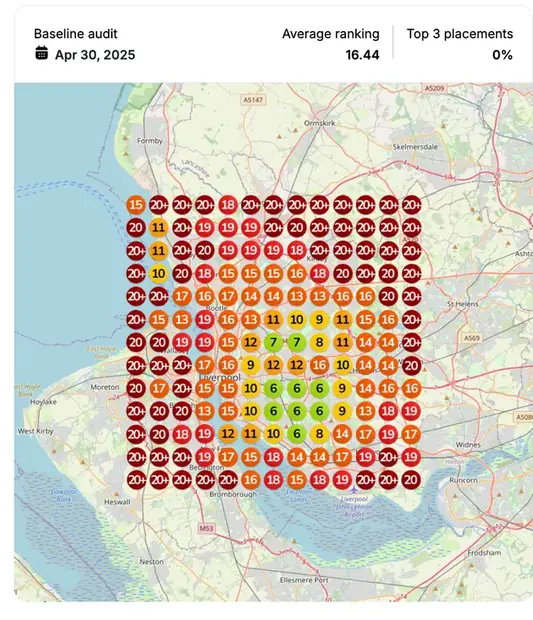
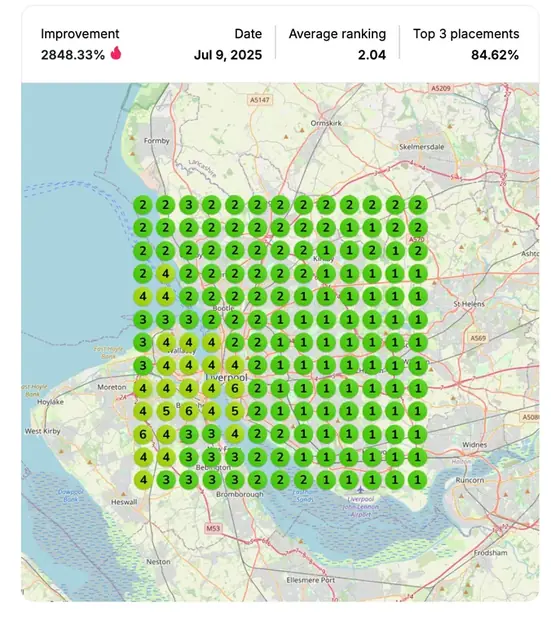
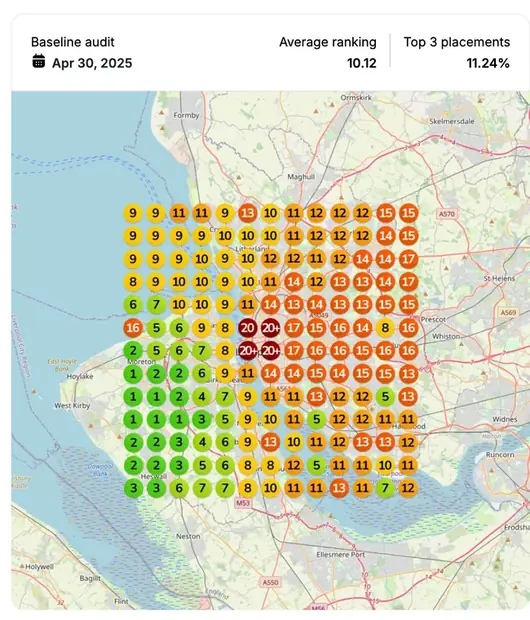
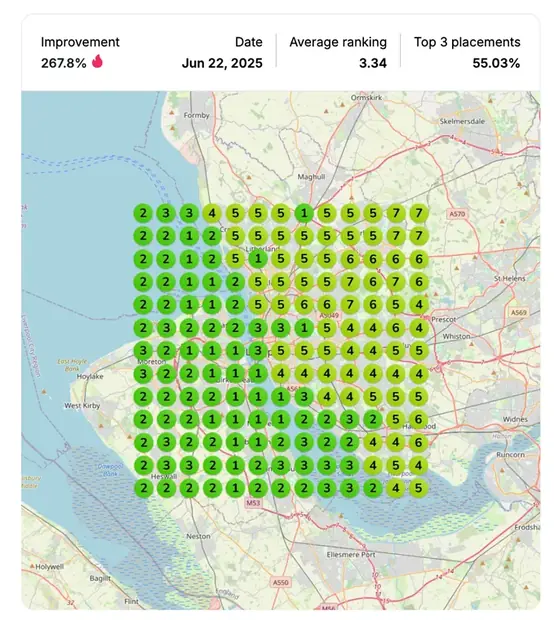
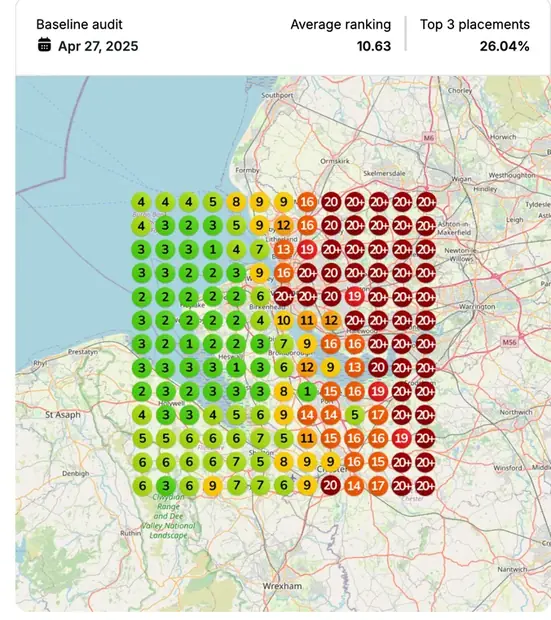
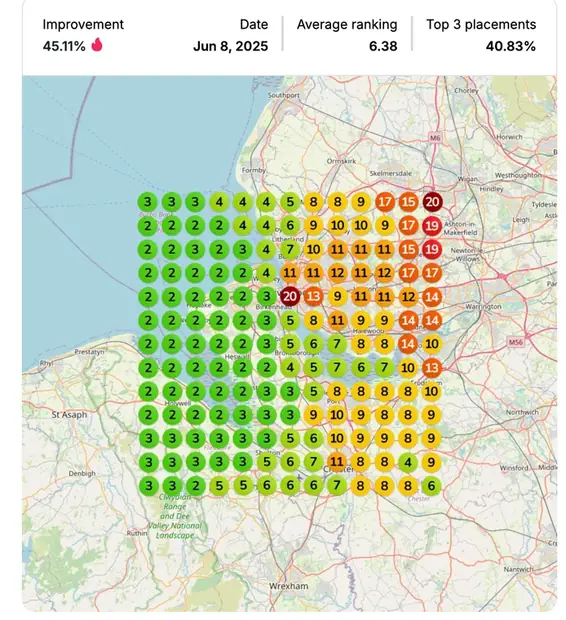
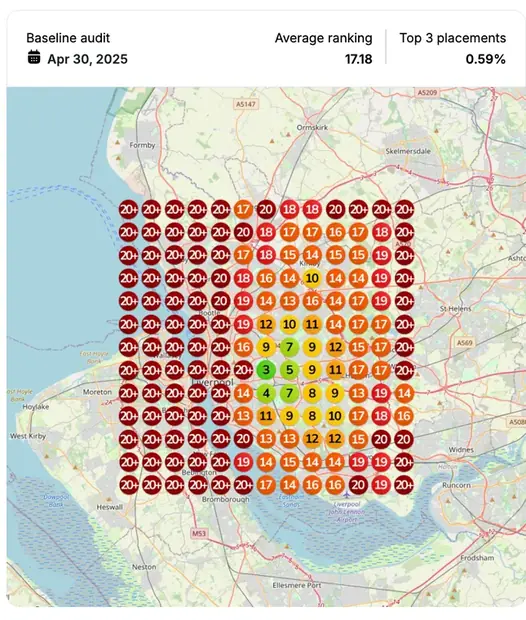
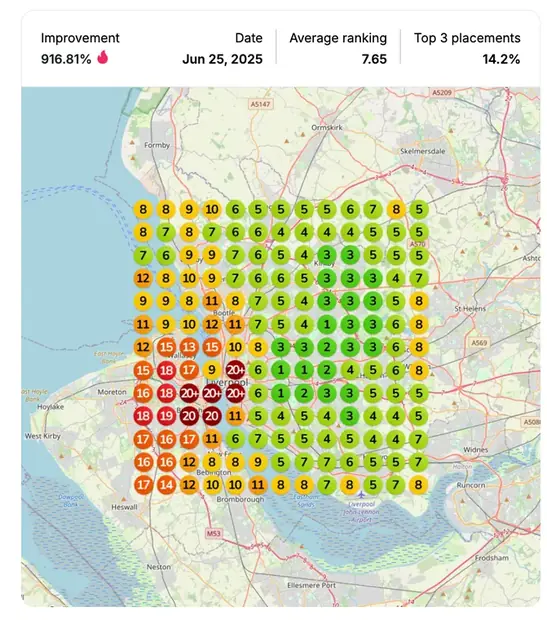
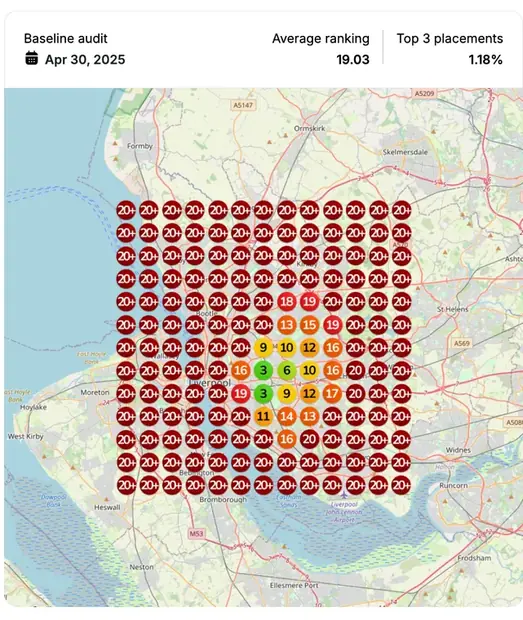
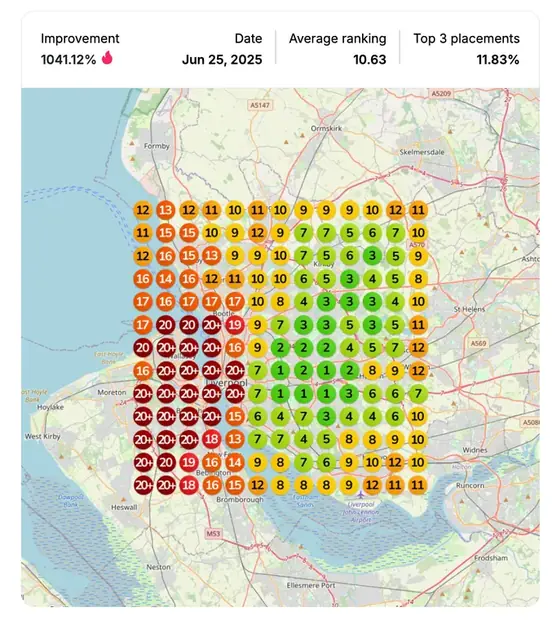
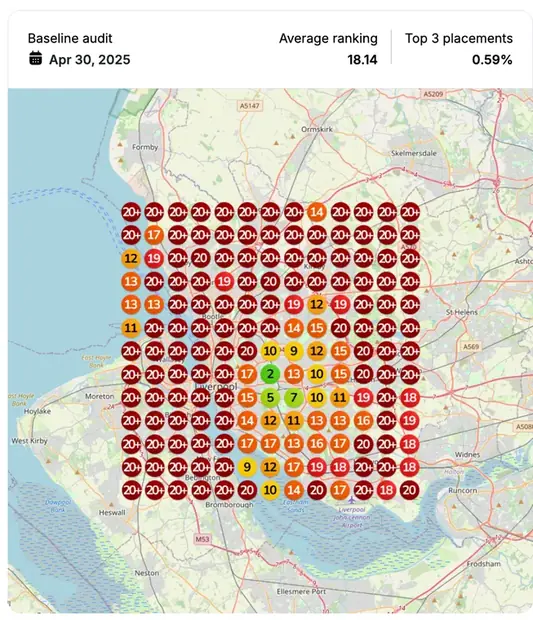
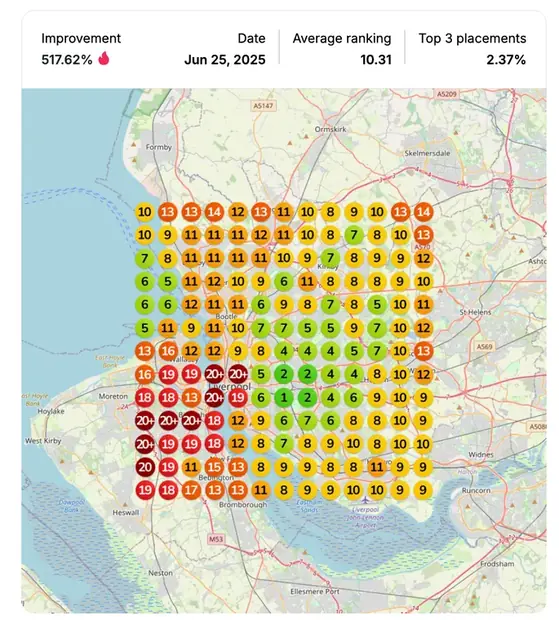
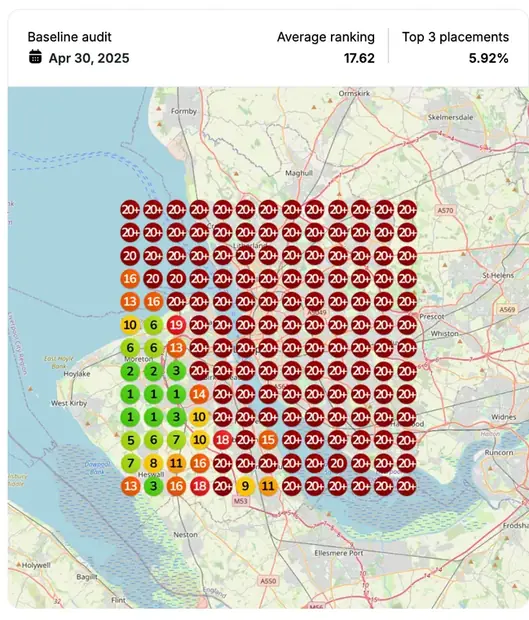
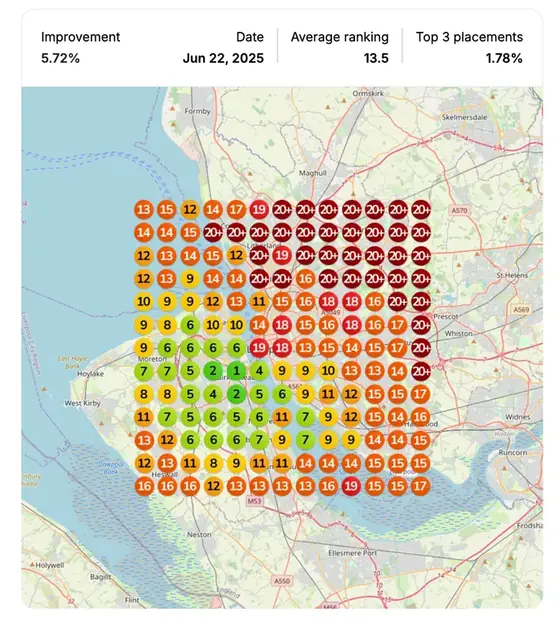
Top-three coverage is the share of grid points where the profile held position one, two or three. Same grid, same points, both dates.
| Keyword | Before | After | Scan dates | Days |
|---|---|---|---|---|
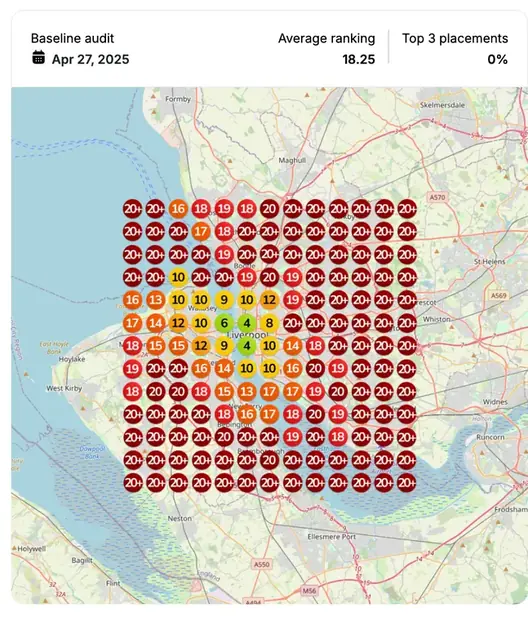
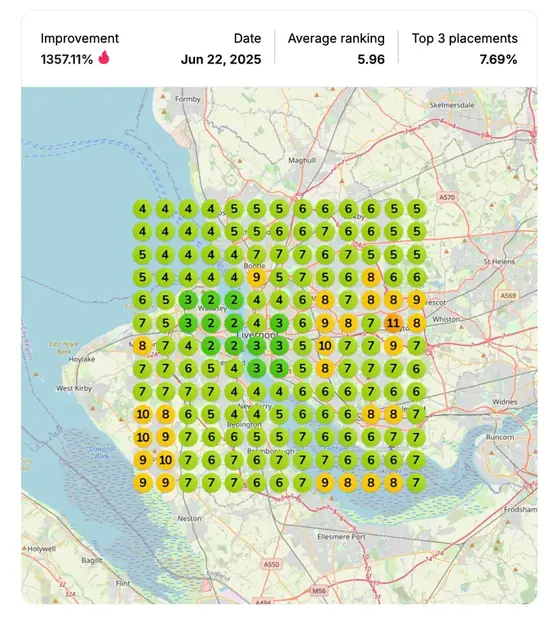
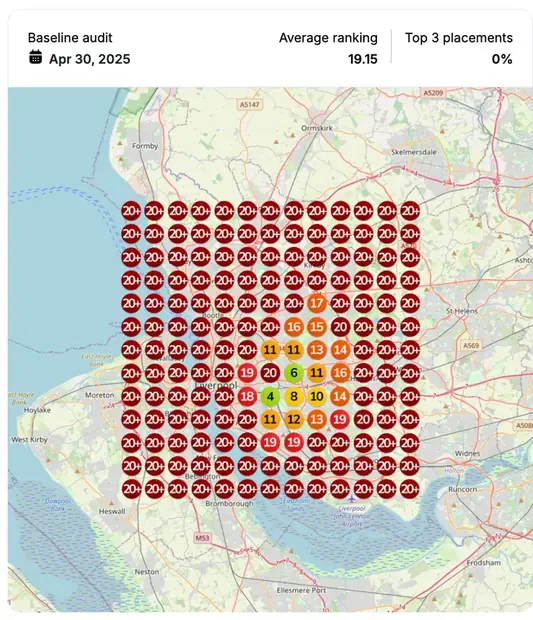
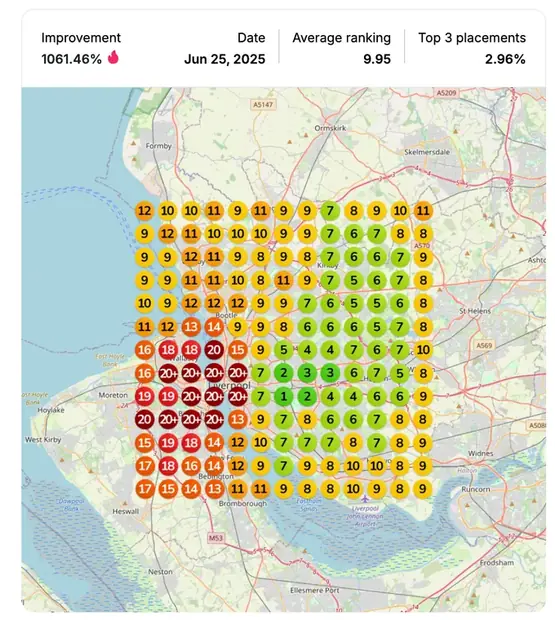
| dog bite lawyer | 0% | 99.4% | Apr 30, 2025 → Jun 25, 2025 | 56 |
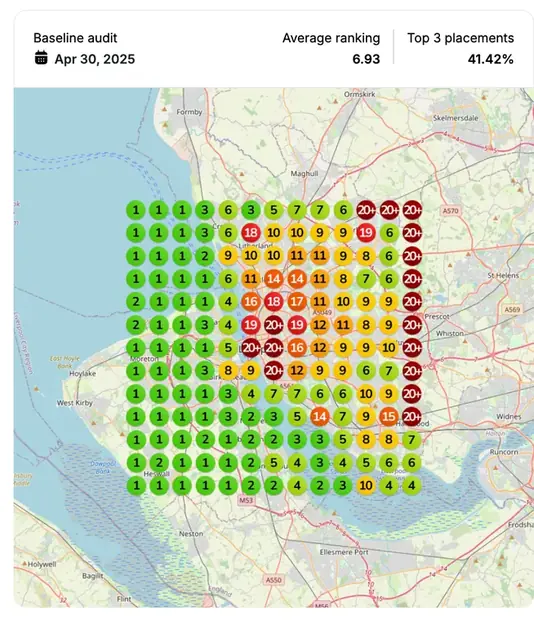
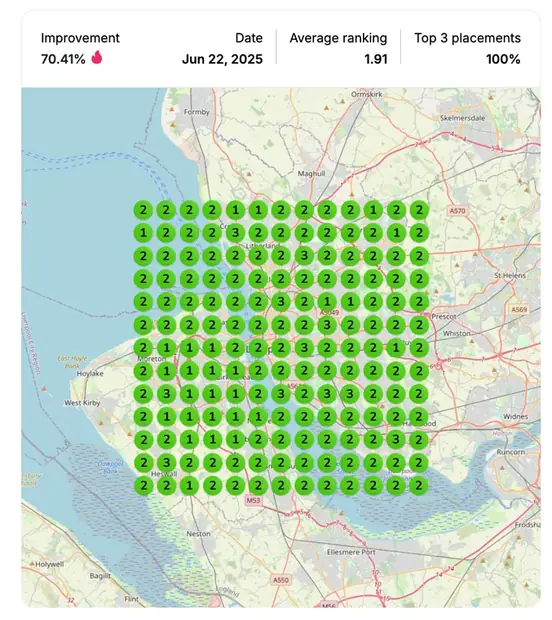
| no win no fee lawyer | 41.4% | 100% | Apr 30, 2025 → Jun 22, 2025 | 53 |
| medical negligence | 50.3% | 100% | Apr 30, 2025 → Jun 22, 2025 | 53 |
| medical negligence lawyer | 30.2% | 89.3% | Apr 27, 2025 → Jun 22, 2025 | 56 |
| personal injury lawyer | 31.9% | 86.4% | Apr 30, 2025 → Jun 22, 2025 | 53 |
| slip and fall attorney | 0% | 84.6% | Apr 30, 2025 → Jul 9, 2025 | 70 |
| motorcycle accident lawyer | 0.6% | 79.3% | Apr 30, 2025 → Jun 25, 2025 | 56 |
| best personal injury lawyer near me | 3.5% | 65.1% | Apr 27, 2025 → Jun 8, 2025 | 42 |
| best personal injury lawyer near me | 11.2% | 55.0% | Apr 30, 2025 → Jun 22, 2025 | 53 |
| accident at work lawyer | 26.0% | 40.8% | Apr 27, 2025 → Jun 8, 2025 | 42 |
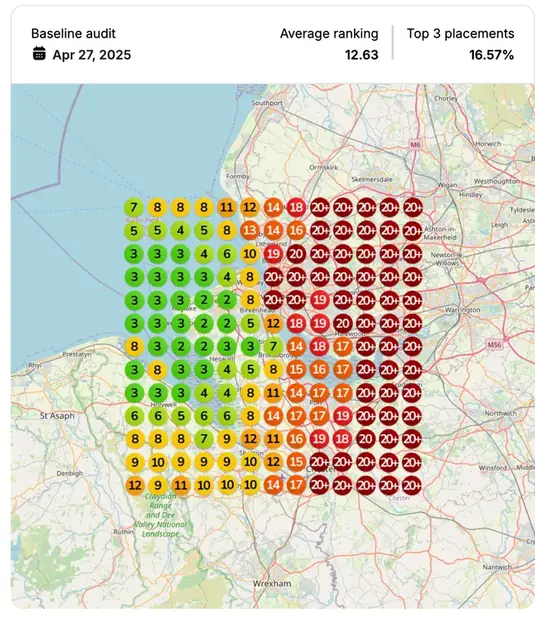
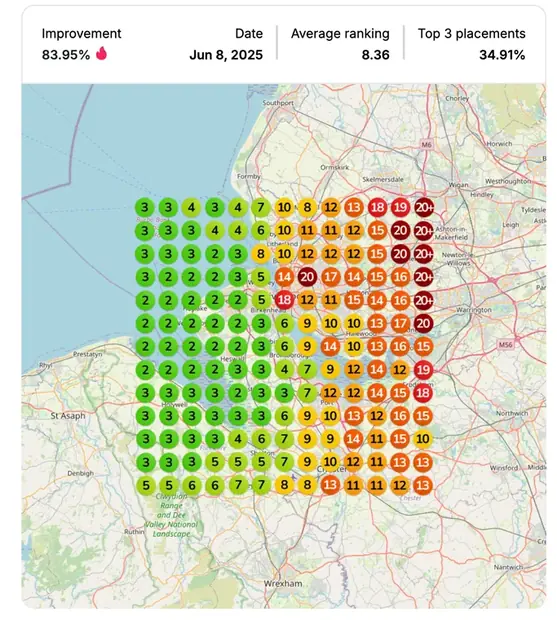
| best accident claims lawyer | 16.6% | 34.9% | Apr 27, 2025 → Jun 8, 2025 | 42 |
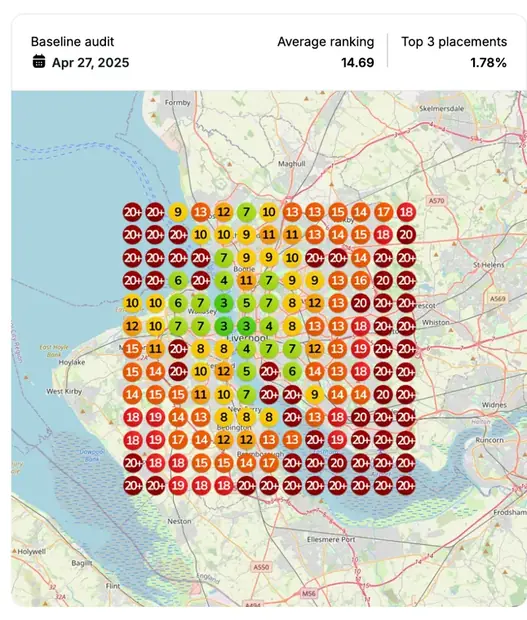
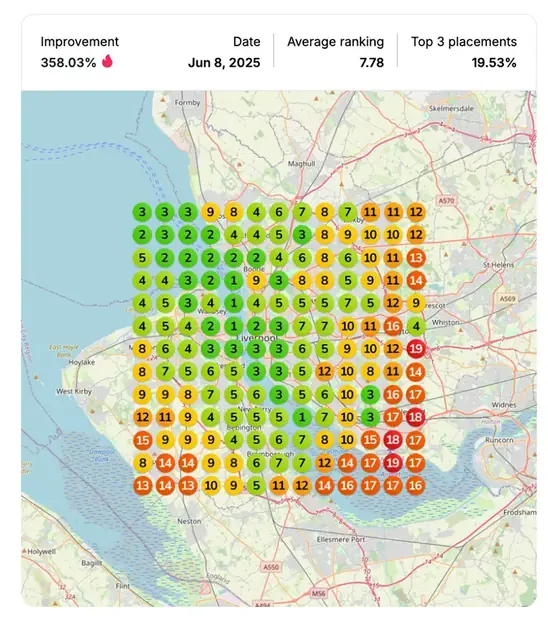
| personal injury lawyer | 1.8% | 19.5% | Apr 27, 2025 → Jun 8, 2025 | 42 |
| car accident lawyer | 0.6% | 14.2% | Apr 30, 2025 → Jun 25, 2025 | 56 |
| personal injury lawyer | 1.2% | 11.8% | Apr 30, 2025 → Jun 25, 2025 | 56 |
| criminal injury lawyer | 0% | 7.7% | Apr 27, 2025 → Jun 22, 2025 | 56 |
| workplace injury lawyer | 0% | 3.0% | Apr 30, 2025 → Jun 25, 2025 | 56 |
| construction accident lawyer | 0.6% | 2.4% | Apr 30, 2025 → Jun 25, 2025 | 56 |
| no win no fee employment lawyers near me | 5.9% | 1.8% | Apr 30, 2025 → Jun 22, 2025 | 53 |
"dog bite lawyer"
0% → 99.4%
"no win no fee lawyer"
41.4% → 100%
"medical negligence"
50.3% → 100%
"medical negligence lawyer"
30.2% → 89.3%
"personal injury lawyer"
31.9% → 86.4%
"slip and fall attorney"
0% → 84.6%
"motorcycle accident lawyer"
0.6% → 79.3%
"best personal injury lawyer near me"
3.5% → 65.1%
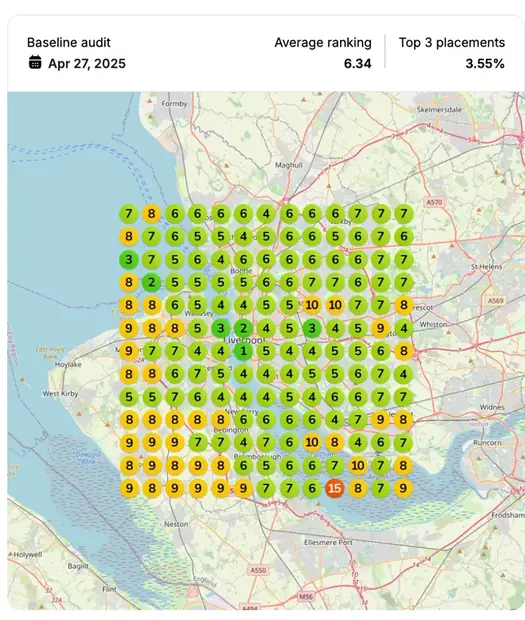
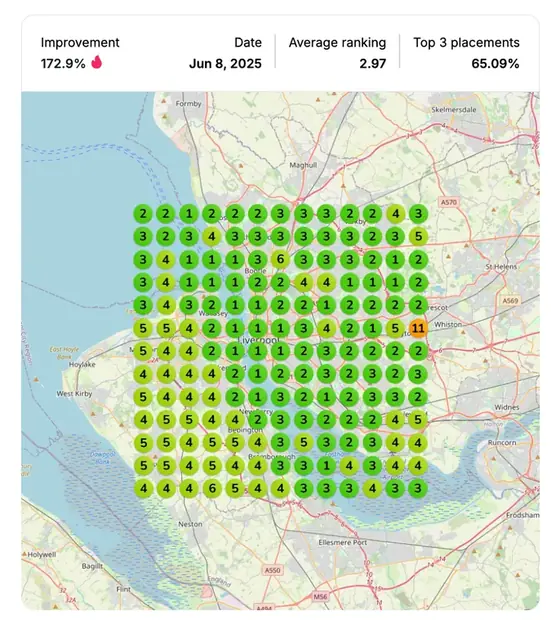
"best personal injury lawyer near me"
11.2% → 55.0%
"accident at work lawyer"
26.0% → 40.8%
"best accident claims lawyer"
16.6% → 34.9%
"personal injury lawyer"
1.8% → 19.5%
"car accident lawyer"
0.6% → 14.2%
"personal injury lawyer"
1.2% → 11.8%
"criminal injury lawyer"
0% → 7.7%
"workplace injury lawyer"
0% → 3.0%
"construction accident lawyer"
0.6% → 2.4%
"no win no fee employment lawyers near me"
5.9% → 1.8%
How this was measured
So you can check it rather than trust it.
Rankings are measured with a geo-grid, not a single rank check. The scanner queries Google Maps from a fixed lattice of points spread across the client’s service area and records the business position at every point. Top-three coverage is the share of those points where the profile holds position one, two or three.
The same grid, the same points and the same keywords are used for the baseline and for every re-scan. Moving the grid between scans would make the comparison meaningless, so the grid is locked at baseline and never changed.
Call, website click and direction request figures are read from the client’s own Google Business Profile performance panel, comparing a period against the immediately preceding period of equal length, or against the same period a year earlier where stated.
Every scan carries its date. Both dates are printed next to every row in the keyword table below, so any claim on this page can be checked against the pair of images it came from.
What these numbers do not say
- These results were selected. They are not typical of every engagement and they are not a forecast of yours.
- Google Business Profile performance figures measure demand reaching the profile. They are not signed jobs and they are not revenue. This page does not claim either.
- Nobody can guarantee a Google ranking. Positions move with competitors, categories, proximity and Google’s own updates.
- One keyword went backwards, from 5.9 percent to 1.8 percent. It is the last row of the table. It sits outside the firm’s core practice area, which is where attention went, and this is what a real keyword set looks like when nobody edits it.
- Three terms appear twice in the table with different baselines. They were scanned on two different dates against two different starting positions, and both readings are shown rather than the better one.
- This engagement reports ranking only. Call and website activity for this client is not published, so no demand claim is made here.
Client name, city and profile ID are withheld on every case study we publish. Contractors get called by vendors the moment they show up in a results page, so we do not put them there.